Name the unit
Before a single span is emitted, we force a written definition of “a use”: call, unique device, billable operation, or something your finance team will recognise.
Backup Cloudhub · Chatuchak studio
We teach API Usage Analytics for Apps to product, platform, and mobile teams who already ship, and who are tired of cardinality explosions dressed up as insight. One curriculum. Real traces. No vanity charts.
Read the flagship syllabus →
From the studio floor
The sampling week stopped us from shipping a client SDK that would have doubled our billable units overnight. I still disagree with their default histogram buckets, but the argument was worth the tuition.
★★★★☆Quota Design Intensive is dry in the best way. We left with alert copy our on-call would actually keep enabled.

Flagship
An eleven-week studio on API Usage Analytics for Apps: defining a billable unit, instrumenting without drowning the binary, sampling rare mobile paths, and reading dashboards with commercial intent. Taught by Arthit Khemkhaeng with live traces from a Bangkok ride-hailing archive.
Evenings in Chatuchak, plus a recorded recap for anyone on a late shift. Informational tuition from ฿24,800 — see the pricing page.
Open the syllabusHow we teach
Before a single span is emitted, we force a written definition of “a use”: call, unique device, billable operation, or something your finance team will recognise.
Head sampling, tail sampling, and client-side thinning are treated as product decisions, not library defaults. Rare checkout paths stay visible.
Dashboards are graded on whether a PM can explain cost movement to a CFO, not on how many panels they contain.
Catalogue

Client telemetry that survives flaky networks and OS background limits.
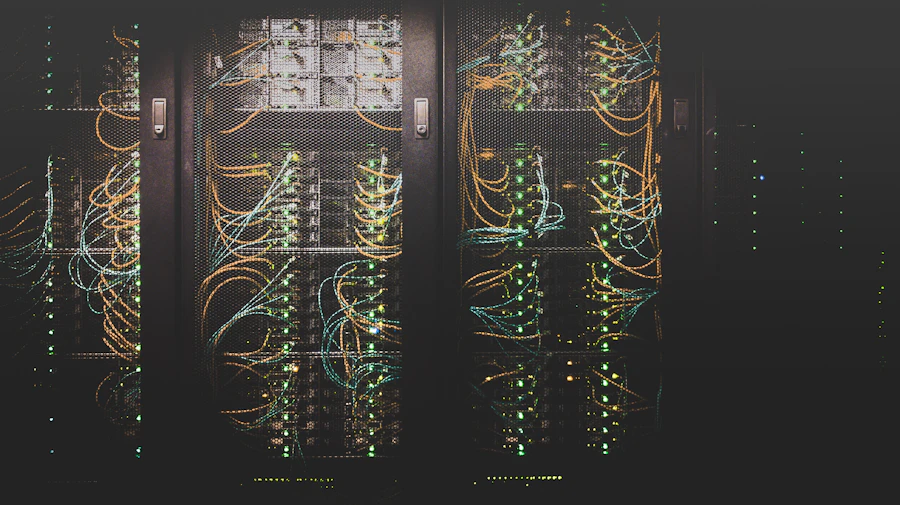
Budgets, burst behaviour, and alerts that do not get muted in week two.

SEA routing, Bangkok peak hours, and what they do to usage graphs.

Bangkok
Chatuchak is not a backdrop. Evening traffic, festival weekends, and mobile-first habits in Thailand show up in every usage graph we study. If your app’s “normal” was modelled on a US lunch break, the ledger will look wrong by 18:00 here.
How the studio works →Next conversation
Tell us which endpoint is lying to finance. We will say whether The Usage Ledger, a clinic, or a private desk is the honest next step.